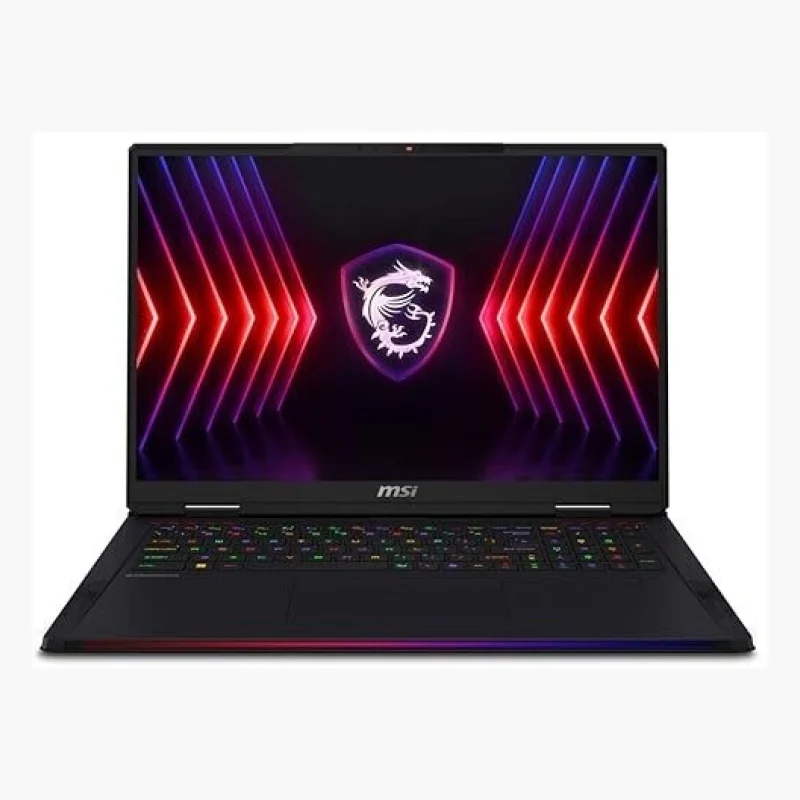
vs
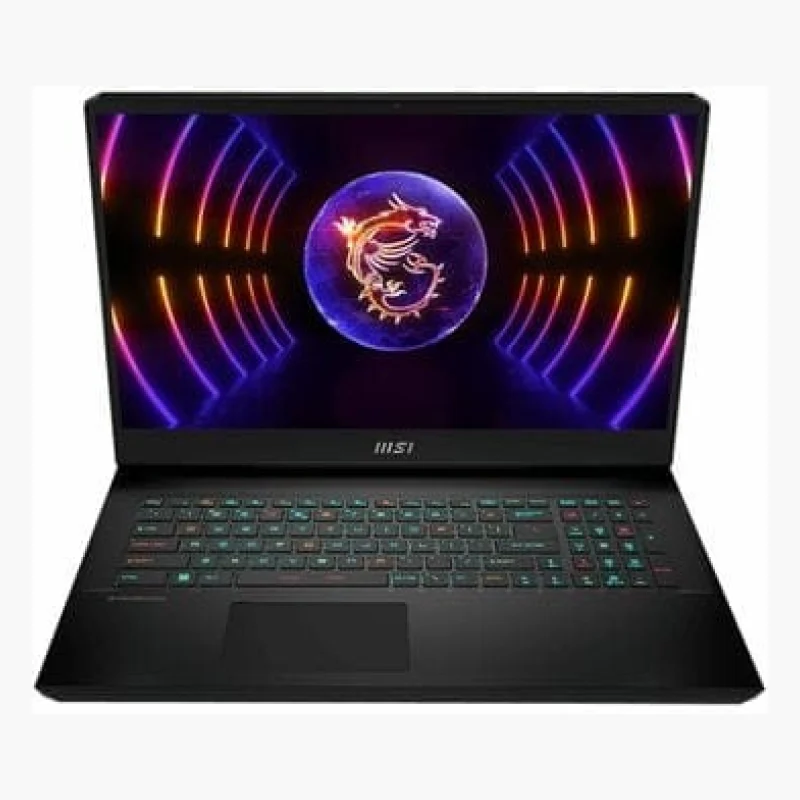
7.2Memory & storage7.5
3.4Battery & portability2.5
Dimensions
Size comparison
Raider 18 HX A14 RTX 4080 (2023)Vector GP77 RTX 4060 (2023)
| Raider 18 HX A14 RTX 4080 (2023) | Vector GP77 RTX 4060 (2023) | Difference | |
|---|---|---|---|
| Depth | 308 mm | 284 mm | +24 mm |
| Width | 404 mm | 397 mm | +7 mm |
| Thickness | 30 mm | 25.9 mm | +4.1 mm |
| Weight | 3.6 kg | 2.8 kg | +0.8 kg |
Drawn to the same scale from the official dimensions (front and side).
Why is Raider 18 HX A14 RTX 4080 (2023) better than Vector GP77 RTX 4060 (2023)?
- Battery capacity100 Wh vs 65 Wh+54%
- GPU shader cores7,424 vs 3,0722.4×
- Resolution class4K (2160p/2400p) vs Full HD (1080p/1200p)
- CPU cores24 vs 14+71%
- Video memory12 GB vs 8 GB+50%
- RAM (base)64 GB vs 16 GB4×
- SSD (base)2,000 GB vs 512 GB3.9×
- Max CPU clock5.8 GHz vs 5 GHz+16%
- RAM speed5,600 MHz vs 5,200 MHz+8%
Why is Vector GP77 RTX 4060 (2023) better than Raider 18 HX A14 RTX 4080 (2023)?
- Weight3.6 kg vs 2.8 kg+29%
- Refresh rate120 Hz vs 144 Hz+20%
- Thickness30 mm vs 25.9 mm+16%
- SSD (up to)2,000 GB vs 2,048 GB+2%
- Screen size14″ vs 17.3″+24%
Specifications
Side by side
| Graphics | ||
| Graphics card | GeForce RTX 4080 Laptop | GeForce RTX 4060 Laptop |
| GPU maker | NVIDIA | NVIDIA |
| GPU power (TGP) | — | 140 W |
| Video memory | 12 GB | 8 GB |
| Video memory type | GDDR6 | GDDR6 |
| GPU shader cores | 7,424 | 3,072 |
| GPU compute (FP32) | — | 16 TFLOPS |
| 3DMark Steel Nomad Light | — | 11,360 |
| Processor | ||
| Processor | Core i9-14900HX | Core i7-13700H |
| CPU maker | Intel | Intel |
| CPU cores | 24 | 14 |
| CPU threads | — | 20 |
| Max CPU clock | 5.8 GHz | 5 GHz |
| Processor options | — | Core i7-13700H, Core i9-13900H |
| Geekbench 6 multi-core | — | 12,607 |
| Geekbench 6 single-core | — | 2,733 |
| Cinebench 2024 multi-core | — | 819 |
| Display | ||
| Screen size | 14″ | 17.3″ |
| Resolution | 3840 × 2160 | 1920 × 1080 |
| Resolution class | 4K (2160p/2400p) | Full HD (1080p/1200p) |
| Refresh rate | 120 Hz | 144 Hz |
| Panel type | — | IPS |
| Brightness | — | 250 nits |
| Response time | — | 7 ms |
| Pixel density | — | 127 ppi |
| Aspect ratio | — | 16:9 |
| Advanced Optimus | — | No |
| MUX switch | — | Yes |
| HDR | — | No |
| Touchscreen | — | No |
| Memory & storage | ||
| RAM (up to) | 64 GB | 64 GB |
| RAM (base) | 64 GB | 16 GB |
| RAM type | DDR5 | DDR5 |
| RAM speed | 5,600 MHz | 5,200 MHz |
| Max. supported RAM | — | 64 GB |
| RAM slots | — | 2 |
| Upgradable RAM | — | Yes |
| SSD (up to) | 2,000 GB | 2,048 GB |
| SSD (base) | 2,000 GB | 512 GB |
| M.2 SSD slots | — | 2 |
| SSD interface | — | PCIe 4.0 x4 |
| Battery & power | ||
| Battery capacity | 100 Wh | 65 Wh |
| Power adapter | 300 W | 280 W |
| USB-C charging (Power Delivery) | — | Yes |
| Design & cooling | ||
| Weight | 3.6 kg | 2.8 kg |
| Thickness | 30 mm | 25.9 mm |
| Width | 404 mm | 397 mm |
| Depth | 308 mm | 284 mm |
| Body material | — | Aluminium, Plastic |
| Colours | Black | Black |
| Cooling fans | — | 2 |
| Vapor chamber cooling | — | No |
| Liquid metal (CPU) | — | No |
| Fan noise (max. load) | — | 57 dB |
| Ports & wireless | ||
| Thunderbolt or USB4 | No | No |
| USB-C ports | — | 1 |
| USB-A ports | — | 3 |
| HDMI | — | HDMI 2.1 |
| HDMI 2.1 | — | Yes |
| (Mini) DisplayPort | Yes | Yes |
| Ethernet port | Yes | Yes |
| SD card reader | — | No |
| 3.5 mm audio jack | — | Yes |
| Wi-Fi standard | — | Wi-Fi 6E |
| Bluetooth | 5.4 | 5.3 |
| Keyboard & camera | ||
| Backlit keyboard | — | Yes |
| Numeric keypad | — | Yes |
| Webcam | — | 720p |
| IR camera (face login) | — | No |
| Fingerprint reader | — | No |
| Audio | ||
| Speakers | — | 2.0 |
| Dolby Atmos | — | No |
Related comparisons
 vs
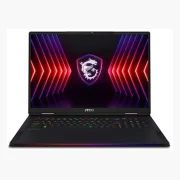 Acer Nitro 16 AN16-51 RTX 4050 (2023)vsMSI Raider 18 HX A14 RTX 4080 (2023)6.86.4
 vsAcer Nitro 16 AN16-41 RTX 4050 (2023)vsMSI Raider 18 HX A14 RTX 4080 (2023)6.36.4
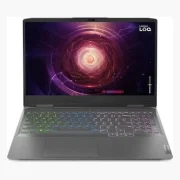 vsLenovo LOQ 16APH8 RTX 4060 (2023)vsMSI Raider 18 HX A14 RTX 4080 (2023)6.56.4
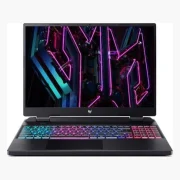 vsAcer Predator Helios Neo 16 PHN16-71 RTX 4050 (2023)vsMSI Raider 18 HX A14 RTX 4080 (2023)6.46.4
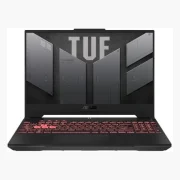 vsAsus TUF Gaming A15 RTX 4050 (2023)vsMSI Raider 18 HX A14 RTX 4080 (2023)6.46.4
 vsDell G15 5530 RTX 4070 (2023)vsMSI Raider 18 HX A14 RTX 4080 (2023)6.56.4